Rent vs Buy in 2026: How to Calculate the Real Break-Even Point
A better rent-vs-buy framework that compares net worth, cash flow, opportunity cost, and timing.
Most rent-vs-buy advice is too simple. It compares rent to a mortgage payment and then declares a winner. That can be misleading because buying a home includes equity growth, transaction costs, maintenance, tax and insurance risk, and the opportunity cost of tying money up in a down payment.
A useful rent-vs-buy decision does not ask only, “Which monthly payment is lower?” It asks, “Which path leaves me in a better financial position after my real holding period?”

Quick answer
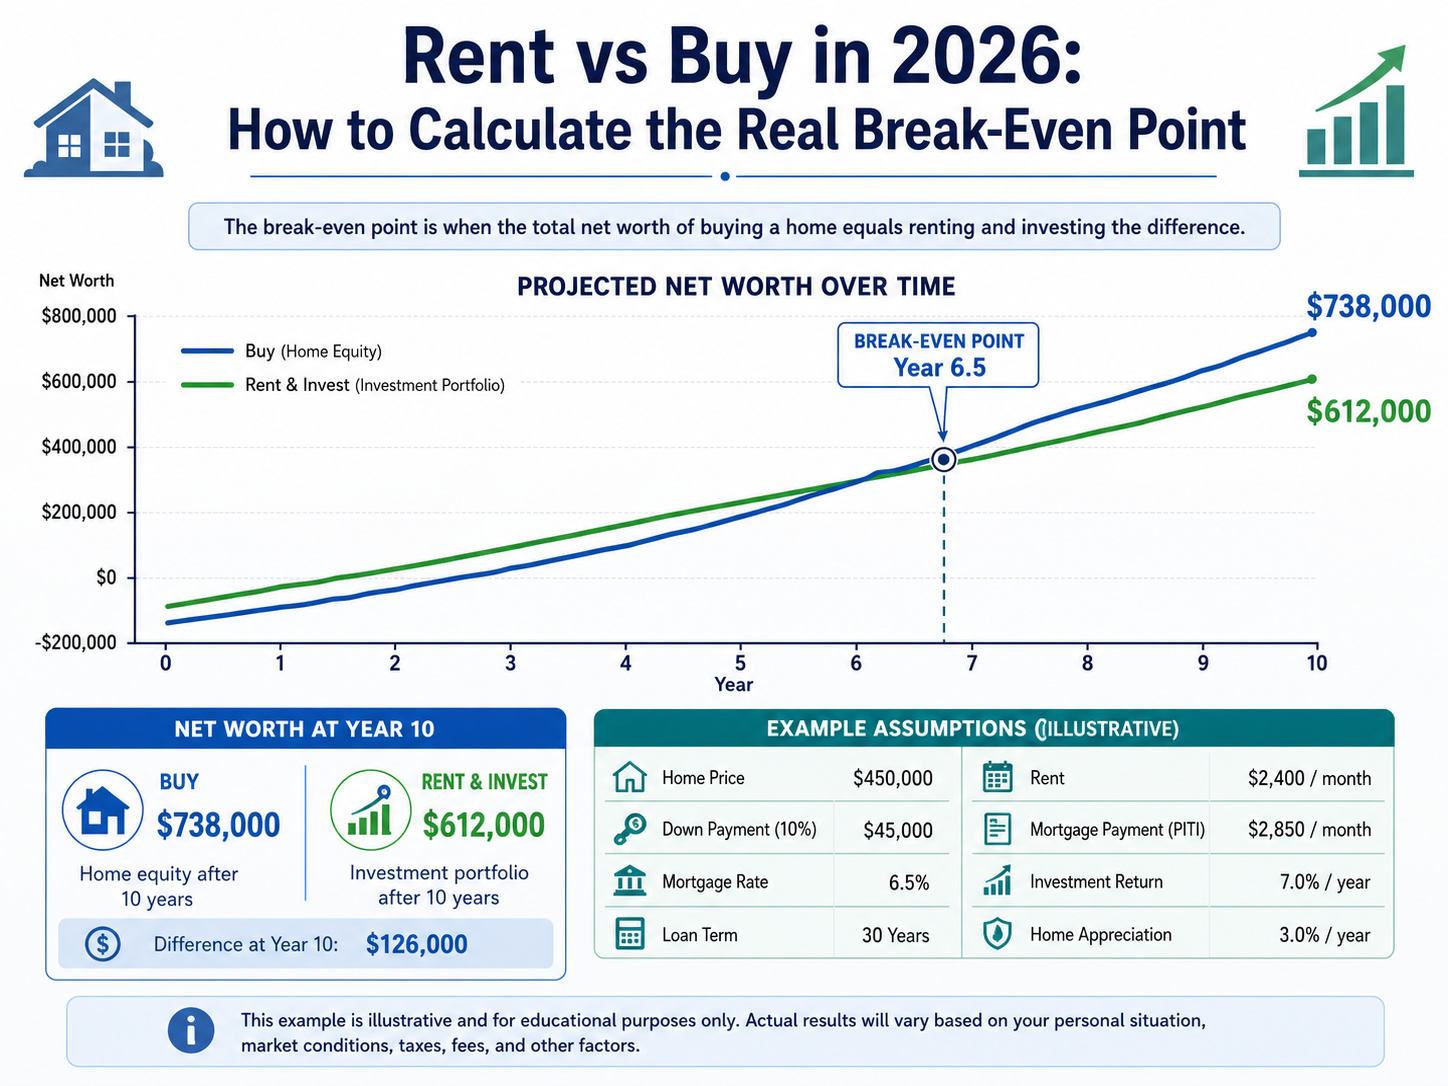
The real rent-vs-buy break-even point is the year when buying leaves you with more projected net worth than renting and investing the difference. To calculate it, compare the buy path and the rent path over the same time period, including home appreciation, mortgage principal paydown, selling costs, repairs, taxes, insurance, HOA dues, rent increases, investment returns, and the opportunity cost of the down payment.
Buying can still make sense when the monthly cost is higher than rent, but usually only if you stay long enough, the home’s non-equity costs are reasonable, and the property has manageable resale risk.
Why the old rent-vs-buy shortcut fails
The old shortcut says: if the mortgage payment is close to rent, buy. If rent is lower, rent. That misses the actual decision.
A mortgage payment contains principal and interest. Principal builds equity. Interest is a true cost. Rent is a true cost, but renting may free up cash to invest. A down payment is not “spent” the same way rent is spent, but it is locked into the home and cannot be invested elsewhere unless you sell, refinance, or borrow against it.
That is why a serious analysis separates four things:
1. Monthly cash flow. 2. True non-equity ownership costs. 3. Equity growth through principal paydown and appreciation. 4. Opportunity cost of the down payment and monthly savings.
The two paths you are really comparing
The buy path
The buy path includes:
- Down payment.
- Closing costs.
- Principal and interest.
- Property taxes.
- Homeowners insurance.
- HOA dues.
- Maintenance and repairs.
- PMI if applicable.
- Home appreciation or depreciation.
- Mortgage principal paydown.
- Selling costs when you exit.
At the end of the time period, the buy path net worth is usually:
Future home value - remaining loan balance - selling costs + cash/investment balances.
The rent path
The rent path includes:
- Monthly rent.
- Rent increases.
- Renter’s insurance.
- Investment of the down payment that was not used to buy.
- Investment of any monthly savings when renting is cheaper.
- Flexibility to move without selling costs.
At the end of the time period, the rent path net worth is usually:
Invested down payment + invested monthly savings - any moving or rental costs not included elsewhere.
Example: buying a $700,000 home vs renting for $3,400 per month
Assume a buyer is considering a $700,000 home with 20% down. The loan is $560,000. At a rate near 6.52%, principal and interest are about $3,547 per month. After taxes, insurance, HOA, and maintenance, the total ownership cash flow may be about $5,350 per month.
The alternative is renting a similar home for $3,400 per month.
| Input | Buy path | Rent path |
|---|---|---|
| Starting home price | $700,000 | N/A |
| Down payment | $140,000 | Invested instead |
| Monthly housing cash flow | about $5,350 | about $3,400 |
| Monthly difference | about $1,950 more to buy | Investable if renting |
| Holding period | 5 years | 5 years |
| Appreciation assumption | 3% per year | N/A |
| Investment return assumption | N/A | 5% per year |
| Selling cost at exit | 6% of future value | N/A |
In this example, buying may not break even quickly because the monthly ownership cost is much higher than rent and the buyer faces selling costs at year five. If the buyer stays ten years, buys below fair value, or sees stronger appreciation, the answer can change.
The key is that the decision depends on timing. A home that is a good 10-year decision can be a poor 3-year decision.
The hidden break-even factors
Transaction costs
Buying and selling are expensive. Closing costs, lender fees, title fees, escrow items, transfer taxes, repairs, concessions, commissions, and moving costs can reduce or delay the benefit of ownership.
Maintenance timing
A buyer might not spend the same amount on maintenance every year. One year may be quiet. The next year may bring an HVAC replacement or roof repair. A good model uses reserves so the analysis does not pretend repairs are zero.
Rent growth
If rent rises quickly, buying may look better over time. If rent growth is slow or you can find below-market rent, renting may remain attractive longer.
Appreciation
Appreciation is powerful but uncertain. It should be modeled as an assumption, not treated as a guarantee.
Down payment opportunity cost
A 20% down payment on a $700,000 home is $140,000. If you rent instead, that money can potentially be invested. Ignoring this makes buying look better than it may be.
Lifestyle utility
Not every benefit fits in a spreadsheet. Stability, school continuity, pets, renovation freedom, privacy, and emotional value matter. But you should price those benefits honestly rather than pretending they are free.
How to calculate the break-even year
Use this step-by-step approach:
1. Estimate the full monthly cost to buy. 2. Estimate monthly rent for a comparable home. 3. Estimate upfront cash required to buy. 4. Estimate how much cash remains invested if you rent. 5. Estimate annual appreciation. 6. Estimate rent growth. 7. Estimate investment return. 8. Estimate maintenance, repairs, and HOA increases. 9. Estimate selling costs at your likely exit year. 10. Compare net worth each year.
The break-even year is the first year when buy path net worth is higher than rent path net worth.
Decision rules for 2026
Buying is stronger when you plan to stay at least seven to ten years
Longer holding periods give principal paydown and appreciation more time to overcome transaction costs.
Renting is stronger when you may move soon
If your job, family, or location is uncertain, flexibility has real value.
Buying is stronger when the rent estimate is high relative to ownership cost
If comparable rent is close to the full ownership payment, ownership may become attractive faster.
Renting is stronger when the ownership premium is very high
If buying costs thousands more per month than renting, the rent-and-invest path deserves serious attention.
Buying is stronger when the home has low repair and resale risk
A home with old systems, location objections, or a narrow buyer pool needs a wider margin of safety.
How RentCast can make the article more original
For a data-backed version, generate static RentCast snapshots for sample markets or representative homes. Useful fields include estimated rent, comparable rentals, property type, bedrooms, bathrooms, square footage, radius, comp count, and days-old filter.
The public article should not expose the API key or call RentCast live. Store aggregated examples in data/blog-market-snapshots/ and include a “Data last updated” note.
How HomeDecisionLab helps
Use the Rent vs Buy calculator at Rent vs Buy calculator. The strongest analysis should compare the buy path net worth against the rent-plus-invest path, not just rent against principal and interest.
If you are evaluating a specific listing, pair the rent-vs-buy analysis with a Home Analysis Report at Home Analysis Report.
FAQ
Is it better to rent or buy in 2026?
It depends on your market, rent, purchase price, mortgage rate, down payment, timeline, maintenance risk, and investment assumptions. The right answer is the one that produces the better combination of affordability, flexibility, and projected net worth for your situation.
What is the rent-vs-buy break-even point?
It is the year when buying becomes financially better than renting after including equity, appreciation, maintenance, taxes, insurance, transaction costs, rent increases, and investment returns.
Should I compare rent to the mortgage payment?
Only as a first glance. A better comparison separates principal from true costs and compares the owner’s projected net worth with the renter’s projected net worth.
Is principal paydown a cost?
Principal paydown is a cash outflow, but it builds equity by reducing your loan balance. It should not be treated the same as interest, taxes, insurance, HOA dues, or repairs.
What if I plan to refinance later?
A future refinance can improve the buy path, but it is not guaranteed. Run the numbers with and without a refinance assumption so the decision does not depend on a future event outside your control.
How long should I stay in a house before buying makes sense?
There is no universal answer. In many cases, buying becomes more attractive with a longer holding period because transaction costs are spread over more years. But local prices, rent, repairs, and appreciation can change the timeline.
Data sources and assumptions used in this article
This article is educational and uses public market context plus example calculations. Numbers should be refreshed before publishing if HomeDecisionLab has newer internal data.
- Freddie Mac Primary Mortgage Market Survey context: 30-year fixed-rate mortgage averaged 6.52% for the week reported June 11, 2026.
- FHFA House Price Index context: U.S. home prices were up 1.7% year over year in Q1 2026 and up 0.5% from Q4 2025.
- U.S. Census/ACS housing-cost framing: ownership cost includes more than the mortgage payment, including taxes, insurance, utilities, fees, and other required housing expenses.
- RentCast can be used for static data snapshots where available: rent estimates, value estimates, comps, property records, listings, and local market trend data. Do not expose an API key in public blog code.
Source URLs:
- https://www.globenewswire.com/news-release/2026/06/11/3310694/0/en/Mortgage-Rates-Average-6-52.html
- https://www.fhfa.gov/reports/house-price-index/2026/Q1
- https://www.census.gov/acs/www/about/why-we-ask-each-question/housing/
- https://www.census.gov/newsroom/press-releases/2025/acs-5-year-estimates.html
- https://developers.rentcast.io/reference/rent-estimate-long-term
- https://www.rentcast.io/api
Educational disclaimer
HomeDecisionLab is an educational decision-support tool, not a lender, real estate broker, tax advisor, or financial advisor. This article should not be treated as personal financial, legal, lending, investment, or tax advice. Buyers and homeowners should confirm numbers with qualified professionals before making an offer, refinancing, selling, renting, or moving.
Educational only. This is not financial, legal, tax, mortgage, investment, or real estate advice.